New in 2.3: create, check and stay connected
Stay connected when the network drops, create a library or an IFS folder from anywhere, grade your RPG sources, take a library list from a job description, find objects open to everybody and compare two systems.
- Stable connections
- Copy to Another System
- Call a program with typed parameters
- Who is signed on
- Member notes
- Create Library
- Create IFS folder or file
- Source Quality Report
- Library list from a job description or user profile
- *PUBLIC Authority Scan
- Compare System Values
- Data Structure Layout
- Show Source with /COPY Expanded
- Check Service Program Signatures
- Failed Jobs
- AI-powered development
- Faster and more reliable
- Green screen
Stable connections
| What happens | What Vanthrex does |
|---|---|
| The network, VPN or laptop sleep drops the connection | Reconnects by itself with the saved sign-on: 5 attempts over about 2 minutes, shown in the status bar; the system becomes active again. Turn off with vanthrex.connections.autoReconnect. |
| The system stops answering but SSH did not notice | Every minute (vanthrex.connections.healthCheckSeconds) a tiny query checks it; a slow answer shows its time in the status bar, two misses in a row reconnect. Check Connection Health and Reconnect Now are on the active connection. |
| You save while the connection is gone | The change is kept on this computer and offered for saving when the system is back (Save Now, Show, Discard); Changes Kept While Offline… lists them. |
| VS Code restarts with member or IFS tabs open | The tabs that could not be read reopen by themselves once you are connected. |
| You disconnect with unsaved members | You are asked: Save and Disconnect or Disconnect Anyway. |
Copy to Another System
With two systems connected, right-click a member or an IFS file (or use the editor menu) → Copy to Another System…. Pick the target system and name; the source file and member are created when missing, and you see how many lines would change before anything is written. A protected system still asks before the change.
Call a program with typed parameters
Right-click a program → Call Program (Typed Parameters)… (also PDM option 16). Vanthrex finds the program’s source (through its entry module for ILE programs), reads its parameter list — free-form dcl-pi, fixed D … PI, *ENTRY PLIST, or PGM PARM(…) in CL — and asks for each value with its type, checking it as you type.
| Parameter | What a plain CALL passes | What Vanthrex passes |
|---|---|---|
| packed(9:2), value -12.5 | packed(15,5) — the program reads garbage | X'000001250D' |
| zoned(5:2), value -1.23 | packed(15,5) | '0012L' |
| int(10), value 42 | packed(15,5) | X'0000002A' |
char(50), value ABC | 32 bytes — the rest is whatever follows | 'ABC' padded to 50 |
Then run it, submit it to batch, or copy the command. Your last values are remembered per program. When the source cannot be found, describe the parameters yourself.
Who is signed on
Jobs view toolbar, quick menu or System Tracker: every 5250 session (user, job, subsystem, status, what it is doing) and the server connections per user (ODBC/JDBC, file server, remote command, SSH…). Click a session for details, its job log, a break message, or to end it (controlled or immediately — asked first). Message everyone signed on sends a break message to every session.
Member notes
Right-click a line in a member → Add Note to This Line. Notes appear at the end of the line and as a 📝 N notes lens at the top of the member; they follow their line when code moves. Notes on This Member and All Member Notes… list them. To share notes with your team, set vanthrex.notes.sharedFile to an IFS file everybody can read and write (for example /home/TEAM/vanthrex-notes.json).
Create Library
Libraries view toolbar, quick menu (Ctrl+Alt+I), System Tracker, or F6 on the PDM library screen. Four short steps: name, text, *TEST or *PROD, and what else to do at the same time — add it to your library list, make it your current library, and create the usual source files (QRPGLESRC, QCLLESRC, QDDSSRC, QSQLSRC, QCPYSRC, QSRVSRC, QCMDSRC, record length 112). At the end you can open it in PDM.
Create IFS folder or file
IFS view toolbar, right-click a folder, quick menu or System Tracker. Type the full path; missing parent folders are created. New files are tagged UTF-8 (CCSID 1208) and opened in the editor. You can set permissions (for example 755 or 644).
Source Quality Report
Right-click a source file → Source Quality Report. Every RPG member is read and scored:
| Measure | Why it matters |
|---|---|
| Code check findings (errors, warnings) | The same checks as in the editor |
| Fixed-format share | How much is left to convert to free format |
| Numbered indicators | Hard to read and to change |
| GOTO / CABxx | Jumps make the flow hard to follow |
| Subroutines and procedures | How the program is structured |
Score: 100 minus errors, warnings per 1,000 lines, GOTOs, numbered indicators and the fixed-format share. Grades: A 90+, B 75+, C 60+, D 40+, E below 40. The lowest scores come first, and the report lists the most frequent findings for the whole source file.
Library list from a job description or user profile
Libraries view (… menu), right-click the active connection, or the System Tracker. Pick a user profile (its job description is used) or a job description; you see what would be added and removed, then replace your library list or add only the missing libraries. *SYSVAL follows the QUSRLIBL system value.
*PUBLIC Authority Scan
Right-click a library, or *PUBLIC on a library in the System Tracker. Objects that give *ALL or *CHANGE to *PUBLIC come first; click one to set *PUBLIC to *USE (asked first). Some objects need more than *USE on purpose — check that programs and users still work.
Compare System Values
With two systems connected: Connections view (… menu) or the All systems tab of the System Tracker. Values that differ come first; values that differ on purpose (dates, serial numbers, devices) are listed apart.
Data Structure Layout
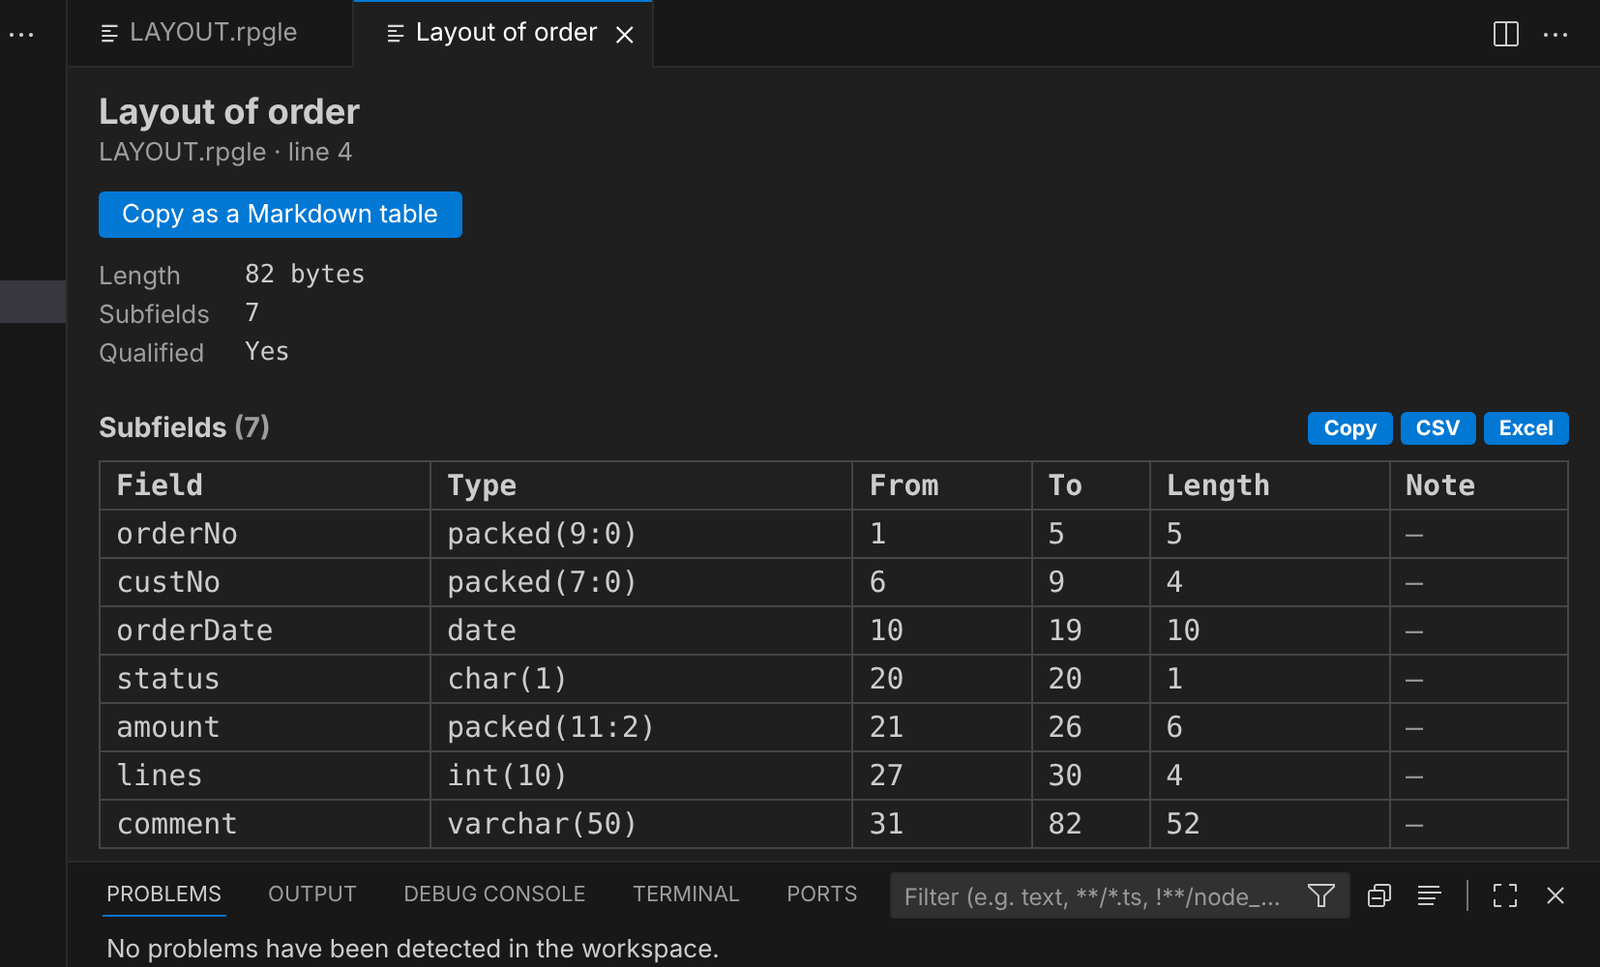 Every subfield with its type, positions and length — without compiling.
Right-click in an RPG source → Data Structure Layout (Positions and Lengths), with the cursor in a data structure (otherwise you pick one). You get every subfield with its type, from and to positions and length in bytes, like the compile listing — without compiling:
- free form (
dcl-ds) and fixed form (D … DS, from/to or length notation); POS,OVERLAY(also*NEXT),DIM(arrays count all elements),LEN;LIKEandLIKEDSof definitions in the same source;EXTNAMEand externally described structures: the fields are read from the database (your library list, or the library inEXTNAME('LIB/FILE')).
When a length cannot be known (for example LIKE of something in a copy member), the later positions are left empty and the page says why. Hover a subfield definition to see its positions (vanthrex.dsLayout.hover), and Copy as a Markdown table for documentation.
Show Source with /COPY Expanded
Right-click in an RPG source → Show Source with /COPY Expanded. A read-only copy opens beside the source with every /COPY and /INCLUDE replaced by the member it names — nested ones too — between >>>>> and <<<<< comments. A member that is included twice is not repeated, and one that is not found is marked. Nothing is saved on the system.
Check Service Program Signatures
Right-click a service program → Check Service Program Signatures, and search your library list or all libraries. You see every program and service program bound to it:
| State | Meaning |
|---|---|
| Signature violation | The bound signature is no longer exported: the program fails when it calls the service program |
| Older signature | Still valid because the binder source keeps the old signature |
| Current signature | Fine |
Click a failing object, or Re-bind all failing objects, to run UPDPGM / UPDSRVPGM … MODULE(*NONE) BNDSRVPGM(…) (asked first). This only picks up the current signature: recompile instead when procedures were removed or their parameters changed. Needs IBM i 7.3 or later with a recent Db2 PTF group.
Failed Jobs
Jobs view toolbar, quick menu or the System Tracker. Jobs that ended with end code 20 or higher (or 10 and higher, if you include controlled ends) in the last hour, day or week, read from the CPF1164 messages in the history log:
| End code | Meaning |
|---|---|
| 20 | Exceeded the end severity (ENDSEV) |
| 30 | Ended abnormally |
| 40 / 50 | Ended before or while active |
| 60 / 70 | Subsystem or system ended abnormally |
| 80 / 90 | ENDJOBABN, or forced to end after the time limit |
A second table counts failures per job name, so a job that fails every night stands out. Click a job to open its job log (QPJOBLOG, or the pending job log) or its other spooled files.
AI-powered development
The @vanthrex chat participant (needs GitHub Copilot Chat or another chat model in VS Code) now works from the real system, not only from the open file:
| Ask | What it reads from the system | What you get |
|---|---|---|
/errors — or Explain with AI when a compile fails, or the light bulb on an error | The compile errors, the source lines around each one, IBM’s help text for each message ID | Each error in plain words, errors with the same cause grouped, the smallest fix |
/document | The program compiled from the source: files used and how, programs called, service programs | Documentation comments in the style of the source, plus a short wiki summary |
/test | Procedure signatures and data structure layouts | The behaviours worth testing, then RPGUnit test source and the build / run commands |
/depends LIB/PGM — or right-click a program | Modules and their sources, service programs, DSPPGMREF references, programs bound to a service program | How it is built and what it uses, and what to recompile, re-bind or promote when something changes |
/joblog 123456/USER/JOB — or right-click a job, Failed Jobs, or the job log analysis page | The job log (or the spooled QPJOBLOG of an ended job), the failing program and statement, its source around that statement | What happened, the root cause and a concrete fix; a button opens the failing line |
The statement in a job log is matched to a source line through the source sequence numbers (compile with OPTION(*SRCSTMT) for exact lines); when the match is approximate, the answer says so. Queries the assistant runs itself are read-only and ask first (vanthrex.ai.confirmQueries). /depends reads file and program references with DSPPGMREF in QTEMP, which needs the Mapepire SQL engine.
Faster and more reliable
- Pages open at once: every report page opens straight away with a loader (what is being read and the seconds it takes); refreshing a page shows a thin busy bar on it.
- System Tracker: opens with the last page of the system at once while it refreshes; the Overview is drawn as soon as its own figures are back and the other tabs fill in after (loading the rest…).
- PDM: the member list shows first; locks and the object status (source newer, not compiled) follow a moment later. Options wait for them, so a locked member is still never deleted.
- Report pages: rows are drawn 300 at a time (Show more), the filter is instant and every column sorts with a click.
- Shared lists: the library list, the objects of a library and the members of a source file are reused by the views for a short time; Refresh, F5 in PDM and any change you make read them again.
- Finding what is slow: the SQL engine starts as soon as you connect; queries slower than 3 seconds and slow start-up steps are written to View → Output → Vanthrex for IBM i.
Green screen
Open 5250 Session — right-click the active connection (or the Connections toolbar, or the quick menu). Vanthrex opens a real 5250 session on that system:
vanthrex.5250.client | What opens |
|---|---|
auto (default) | IBM i Access Client Solutions when it is installed, otherwise tn5250 in a VS Code terminal |
acs | IBM i Access Client Solutions (vanthrex.5250.acsPath if it is not found by itself) |
tn5250 | tn5250 in a VS Code terminal (vanthrex.5250.ssl, vanthrex.5250.port, vanthrex.5250.deviceName) |
command | Your own emulator: vanthrex.5250.command, with ${host}, ${user}, ${device} and ${port} replaced |
Command line (5250 style) — Ctrl+Alt+K. Type at ===> and press Enter; F4 prompts the command, F9 or ↑ brings back earlier commands, F12 clears.
- Every command shows its messages as a green screen would (click a message ID for IBM’s help text).
- Display commands (DSPLIBL, DSPFD, DSPFFD, DSPOBJAUT, DSPJOB, DSPPGMREF, WRKSYSSTS…) print their output and it is shown under the command; the spooled file is removed afterwards.
- Interactive commands open the Vanthrex screen that does the same: WRKACTJOB, WRKOBJLCK, DSPJOBLOG, WRKJOB / DSPJOB, DSPMSG / WRKMSGQ, WRKSYSVAL, WRKUSRPRF, WRKOUTQ, WRKJOBQ, WRKSBS, WRKSBSJOB, WRKJOBSCDE, NETSTAT, WRKSYSSTS, DSPOBJD, DSPFD, STRSQL, STRSEU, WRKSAVF, WRKMBRPDM / WRKOBJPDM / WRKLIBPDM.
- Commands that only work on a display (STRSDA, SIGNOFF, STRDBG…) offer to open a 5250 session.
Work with Active Jobs — Jobs view toolbar, the connection menu, the System Tracker, or WRKACTJOB on the command line. Jobs are grouped by subsystem; type an option next to one or more jobs and press Enter:
| Option | Action |
|---|---|
| 3 / 6 | Hold / release |
| 4 | End — controlled or immediately, asked once for all the jobs |
| 5 / 11 | Work with the job (details, call stack, locks) |
| 7 | Display and answer the message the job waits for |
| 8 | Its spooled files |
| 10 / L | Job log / live job log |
F5 refreshes, F10 restarts the statistics (CPU %, disk I/O), F11 shows other columns (threads, temporary storage, CPU time, disk I/O, pool, priority). Filter by subsystem, user, job or status, position to a job, or refresh every 5 to 60 seconds.